
รายละเอียดสินค้า
| ข้อมูล |
น้ำหนัก
บาร์โค้ด
ลงสินค้า
อัพเดทล่าสุด
|
| รายละเอียดสินค้า |
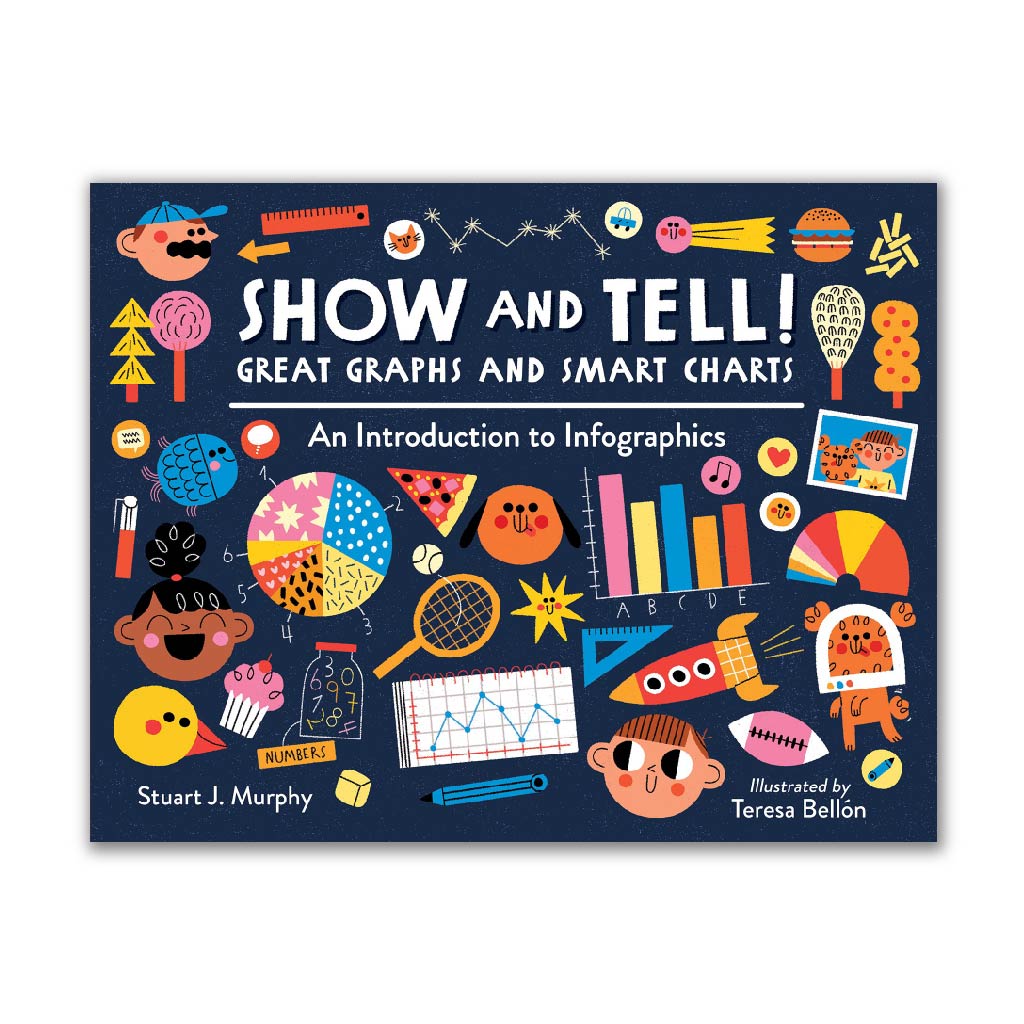
An Introduction to Infographics
author : Stuart J. Murphy | illustrator : Teresa Bellón | Paperback | 6-9 years | 48 pages
ผู้แต่ง : Stuart J. Murphy | ผู้วาดภาพประกอบ : Teresa Bellón | ปกอ่อน | สำหรับอายุ 6-9 ปี | 48 หน้า
A visual-learning expert races up the charts and graphs math success with kid-friendly content sure to help with homework.
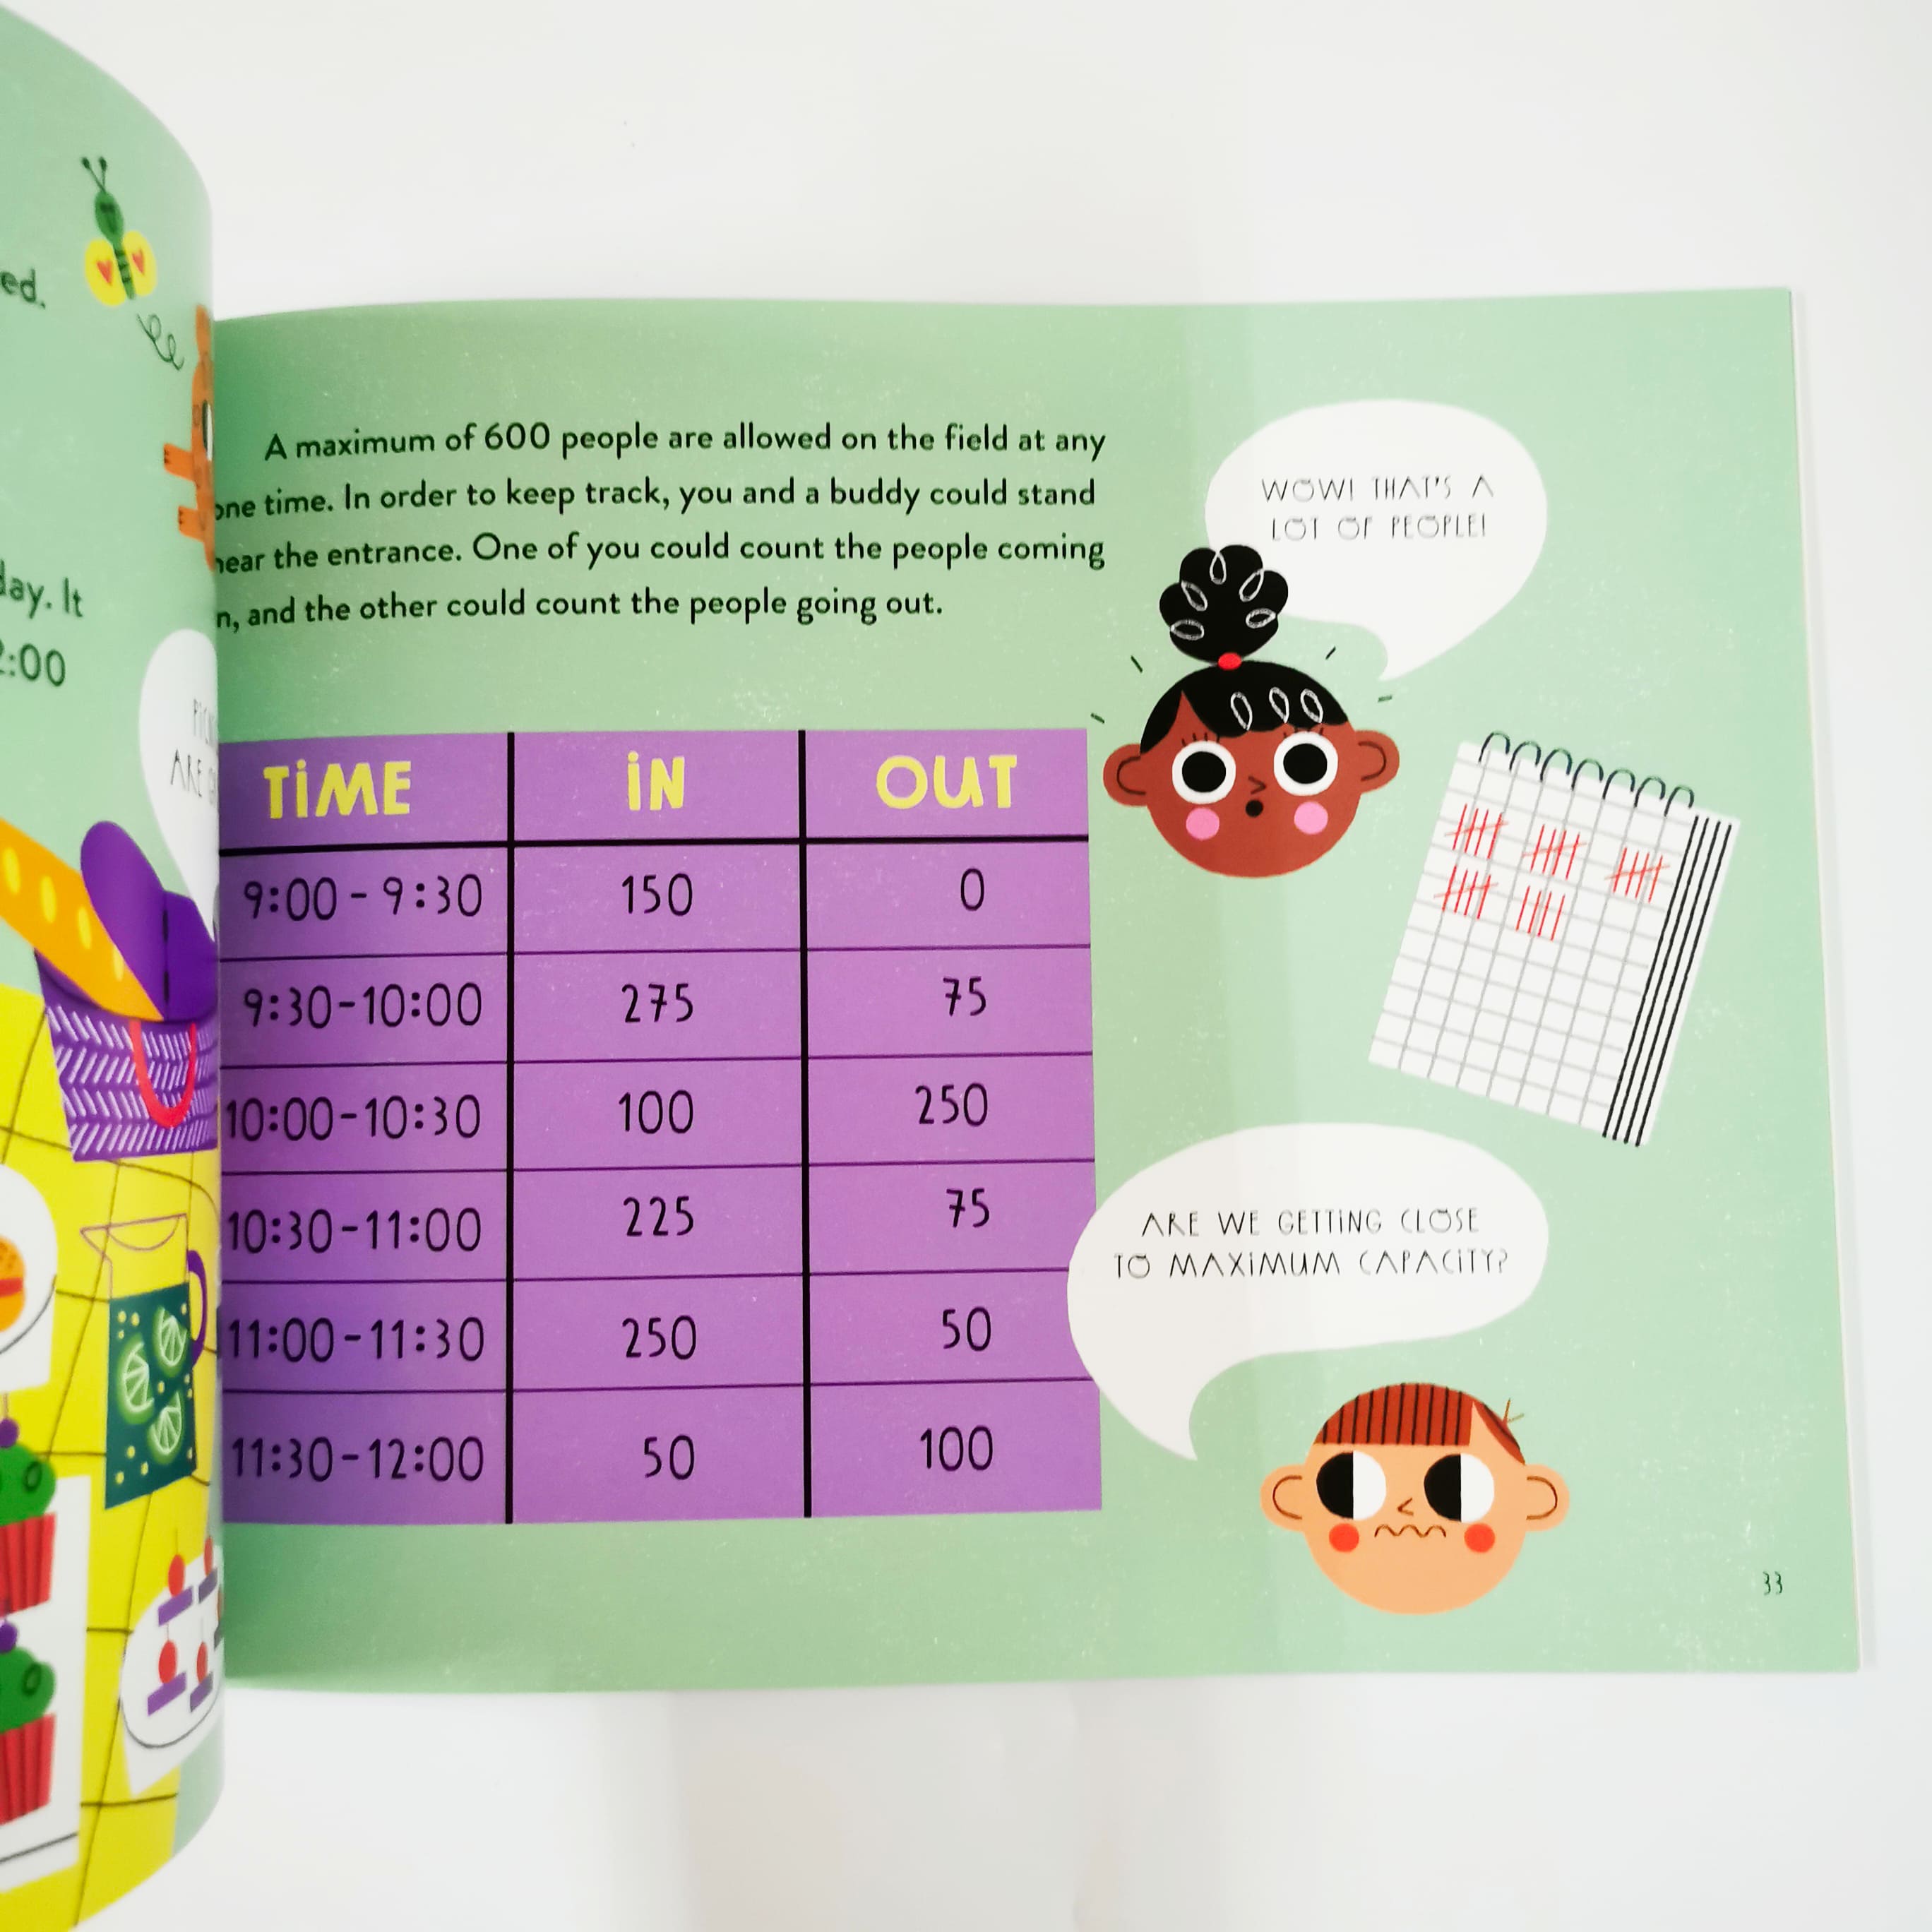
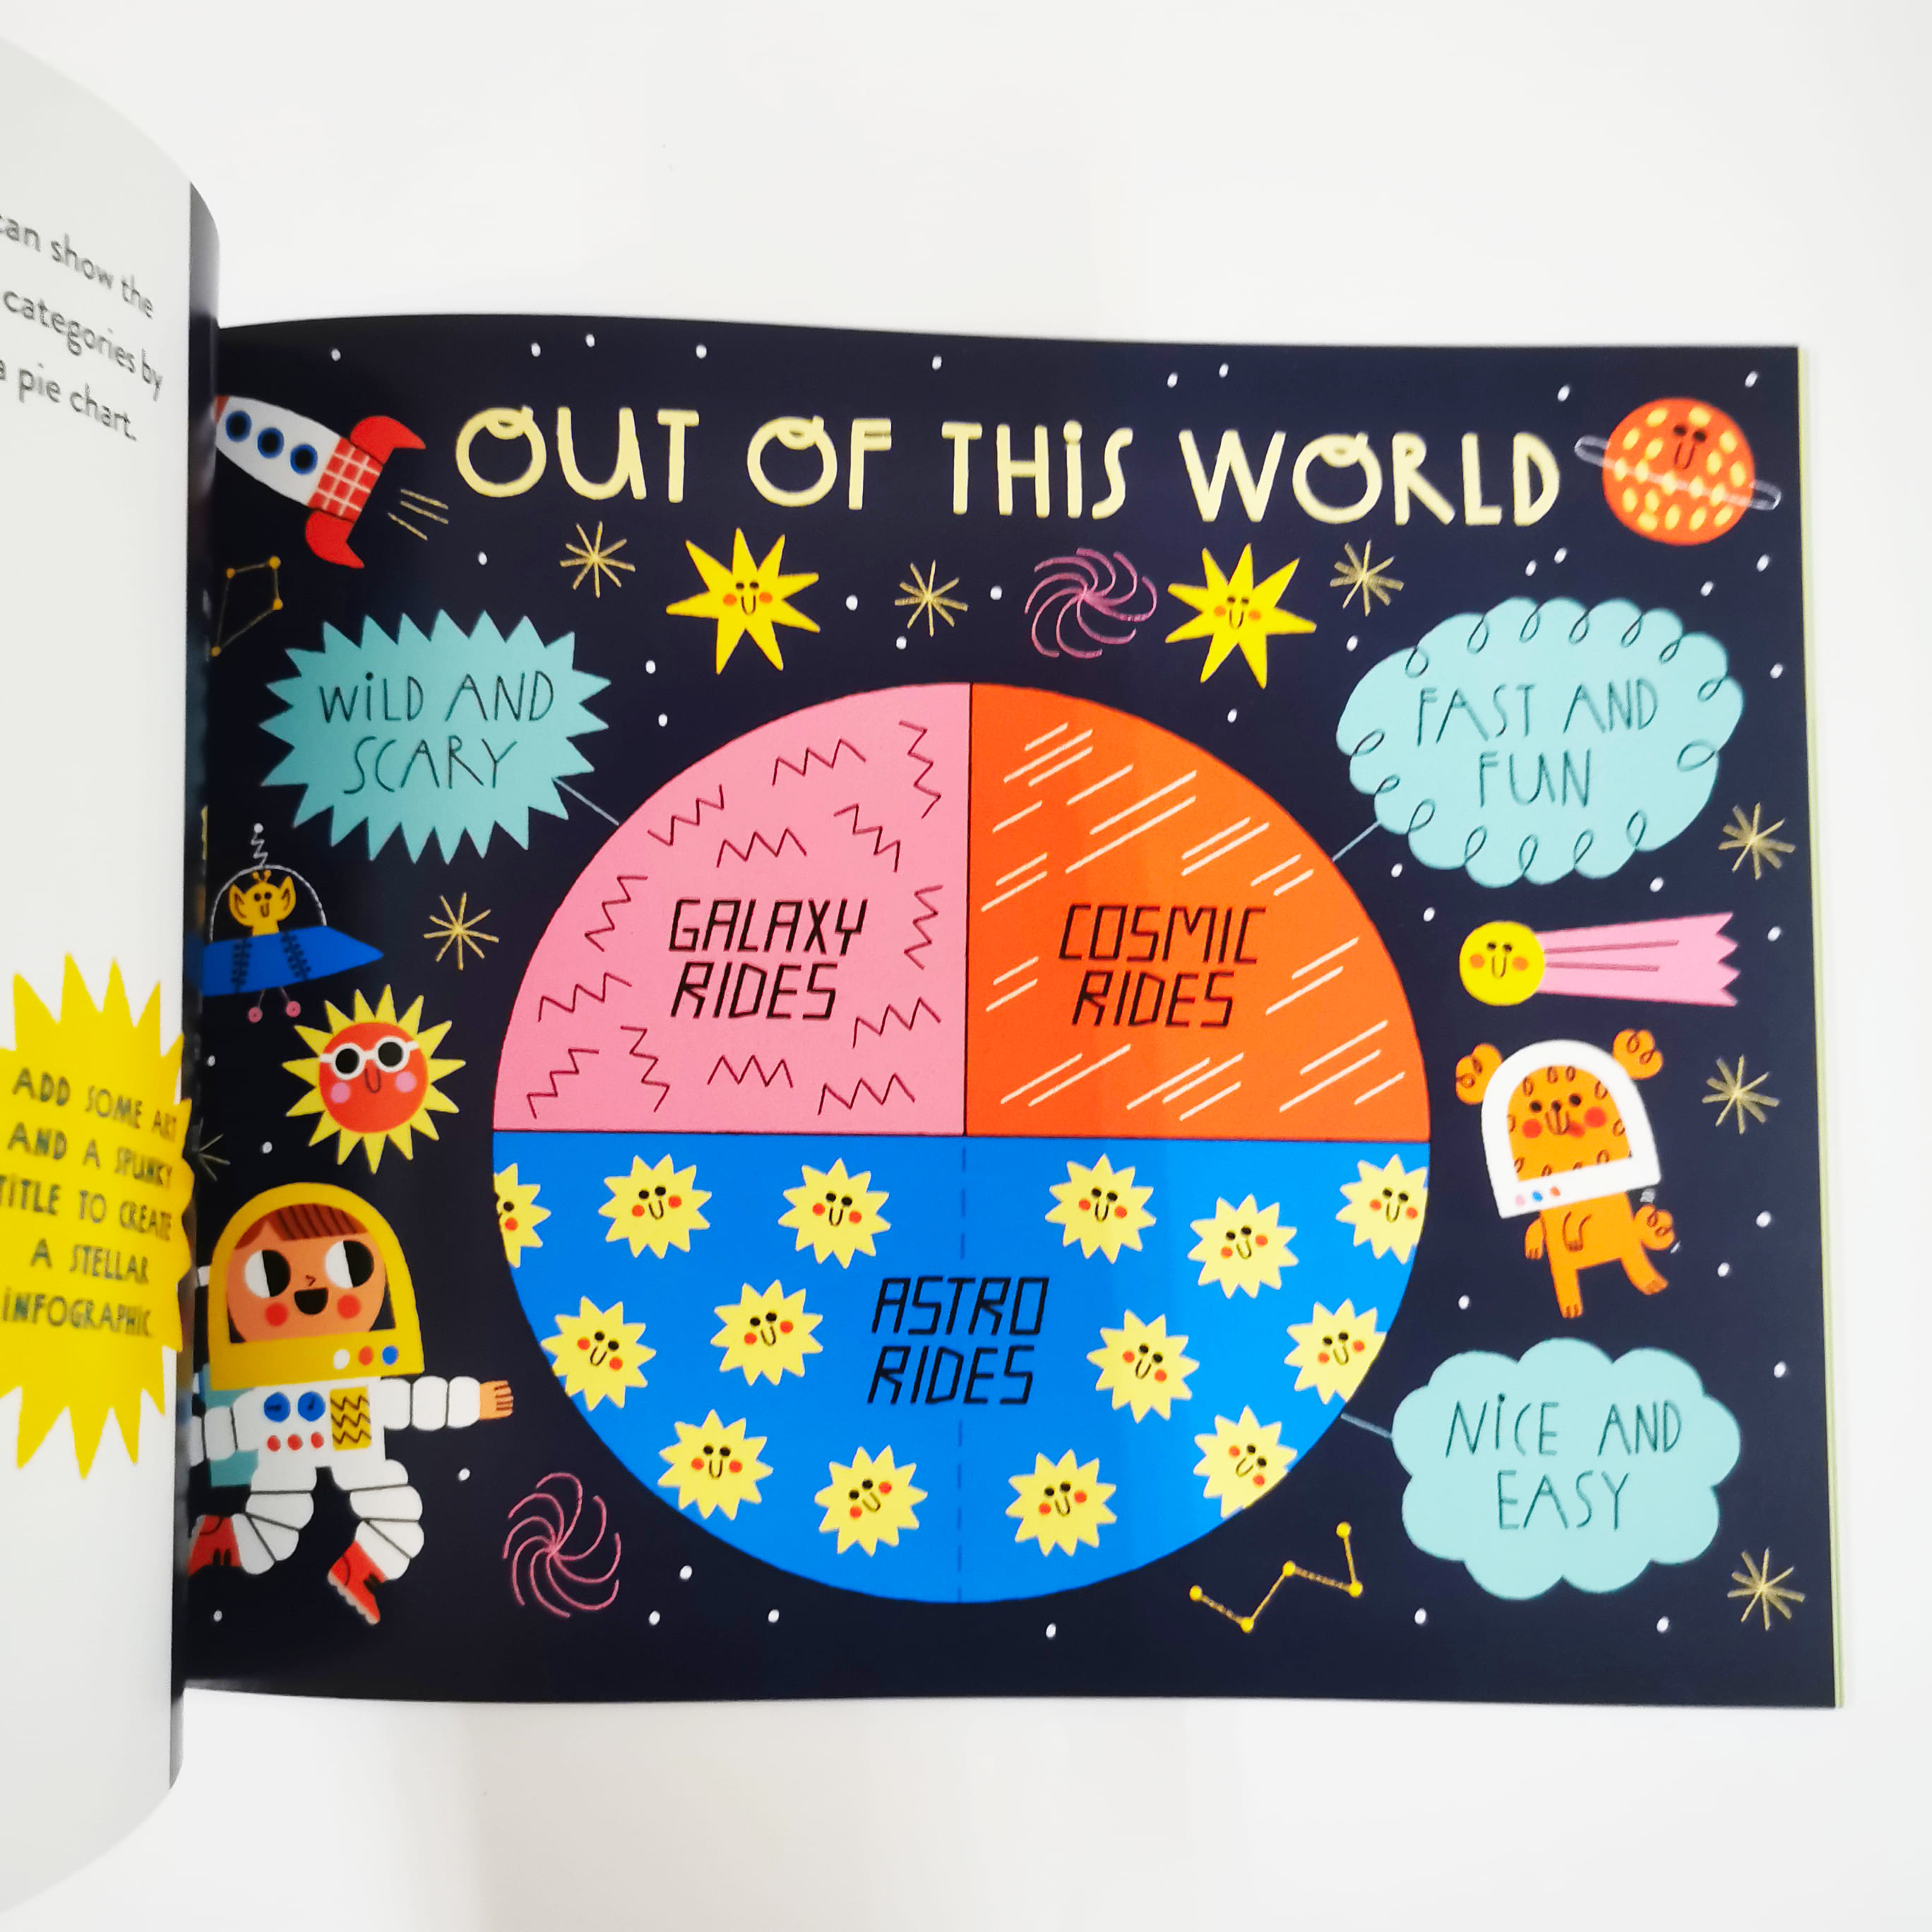
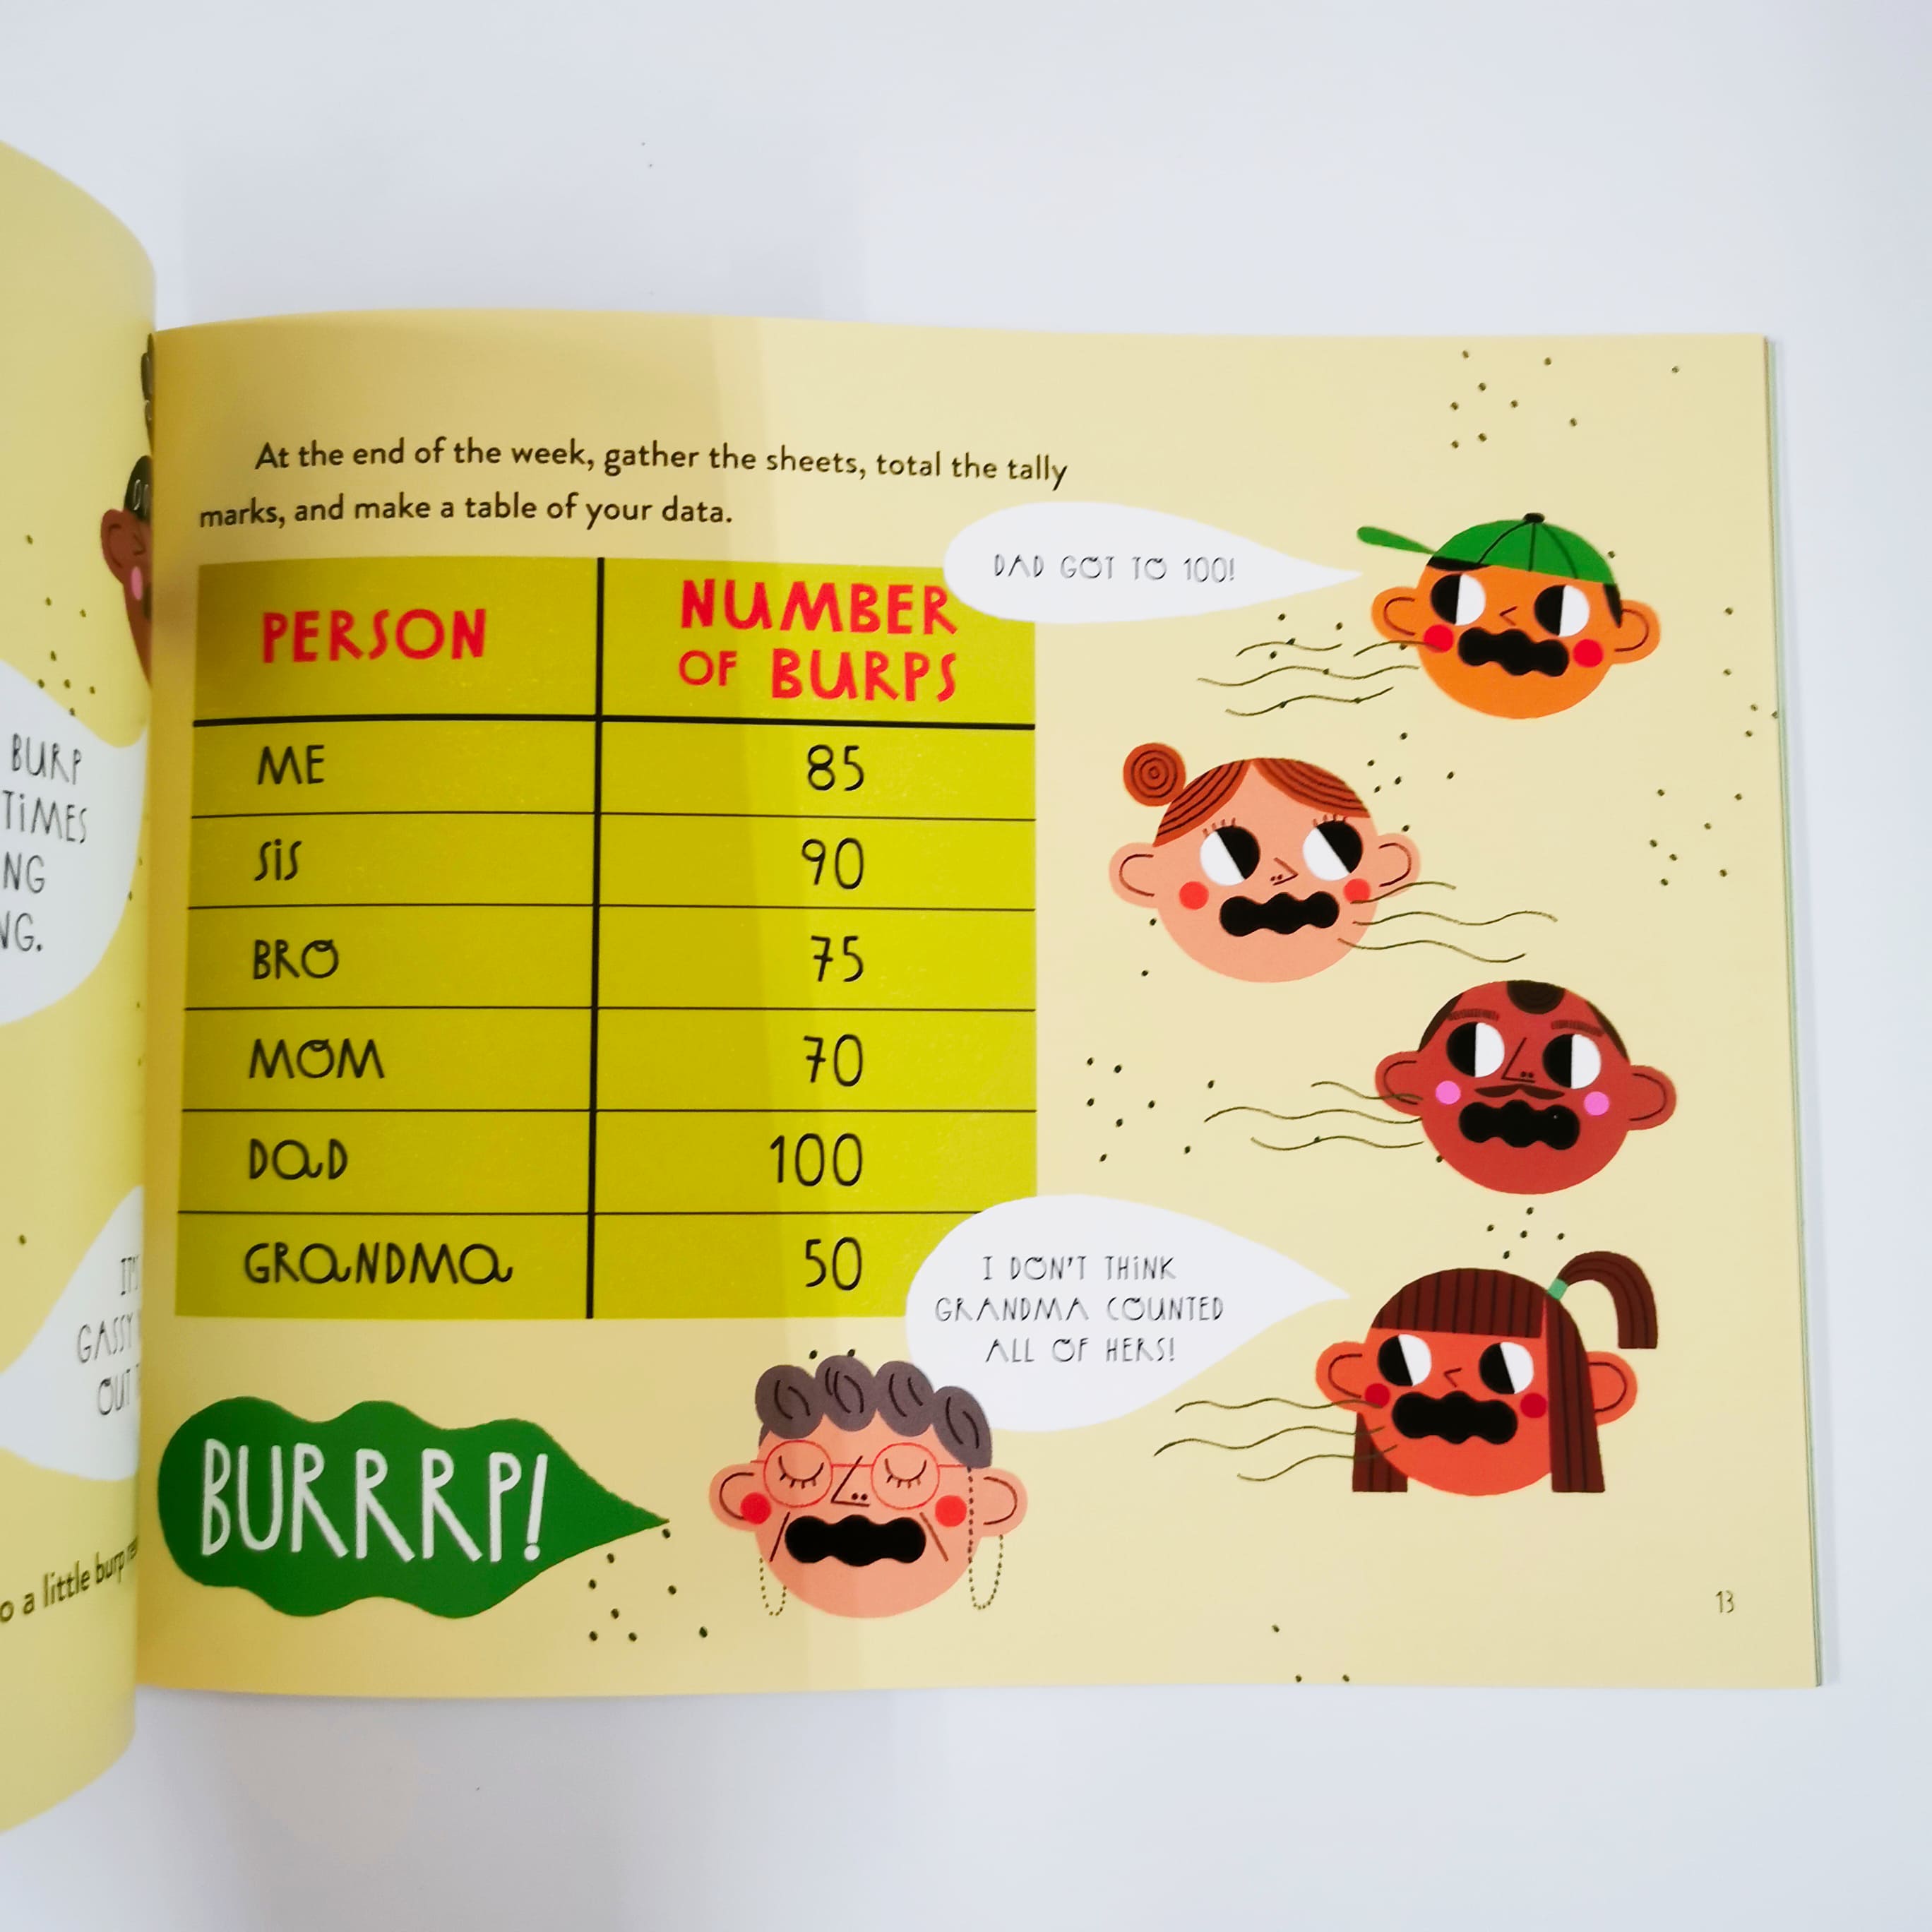
Want to find the most popular meal in the cafeteria? Compare town sports enrollments? Or maybe you just want to know who burps the most in your family! Learn what line graphs, bar graphs, pie charts, and pictographs are and how and when to use them to represent data.
Each project shows how to build a chart or graph and ties it all together with a creative infographic that really puts the A in STEAM (Science, Technology, Engineering, ARTS, and Mathematics). Whether used as an introductory aid or to underscore previous knowledge, the book prepares today's visually savvy children to succeed in school and life by analyzing the world around them.
    |
| เงื่อนไขอื่นๆ |
|
| Tags |
 Read Me A Book
สมัครสมาชิกร้านนี้ เพื่อรับสิทธิพิเศษ
 ธ.กรุงเทพ
▲
▼
รายการสั่งซื้อของฉัน
รายการสั่งซื้อของฉัน
ข้อมูลร้านค้านี้

Read Me A Book
ร้านของเรานำหนังสือเข้ามาจากสำนักพิมพ์หลายที่ เช่น Penguin Random House, Simon & Schuster, Macmillan เรามีทั้งหนังสือภาพ หนังสือหัดอ่าน นวนิยายภาพ โดยแต่ละเล่มที่เราเลือกมาจะมีทั้งภาพที่สวย เนื้อหาสนุก ให้ความรู้ หรือแม้กระทั่งช่วยพูดในเรื่องที่ดูเหมือนยากให้น้องๆได้เข้าใจ Read Me A Book อยากจะเป็นส่วนหนึ่งที่ทำให้เด็กๆสนุกกับการอ่าน มีวันที่ดี ได้เติบโตและรับรู้ถึงสิ่งรอบๆตัวของพวกเขา
เบอร์โทร : 0856656363
อีเมล : readmeabookth@gmail.com
อีเมล : readmeabookth@gmail.com
ส่งข้อความติดต่อร้าน
เกี่ยวกับร้านค้านี้
ค้นหาสินค้าในร้านนี้
ค้นหาสินค้า
สินค้าที่ดูล่าสุด
บันทึกเป็นร้านโปรด
Join เป็นสมาชิกร้าน
แชร์หน้านี้
แชร์หน้านี้
↑
TOP เลื่อนขึ้นบนสุด
TOP เลื่อนขึ้นบนสุด
สินค้าในตะกร้า ({{total_num}} รายการ)

ขออภัย ขณะนี้ยังไม่มีสินค้าในตะกร้า
ราคาสินค้าทั้งหมด
฿ {{price_format(total_price)}}
- ฿ {{price_format(discount.price)}}
ราคาสินค้าทั้งหมด
{{total_quantity}} ชิ้น
฿ {{price_format(after_product_price)}}
ราคาไม่รวมค่าจัดส่ง
➜ เลือกซื้อสินค้าเพิ่ม